Display the Pressure Field
1. Load the Data
Load the pressure data similar to how you did for the wing section example:
Click the Load Data button in the control view, and then click the Hide Others button.
Click the “Enable ParaView” toolbar button (
) to make the ParaView toolbars and filters visible.
This time, don’t close the Pipeline Browser panel but instead undock it and drag/drop it onto the OpenFOAM so that it is displayed as a sidebar tab.
To see the final time step, find the dropdown box labeled Time in the ParaView toolbars and change it from
0.0to0.5.To update the color map to the 0.5 sec data, find and click the “Rescale to Data Range” button (
) in the toolbar area.

The result will be a fairly uninteresting view of the wind tunnel outside surface. (You can also zoom inside the wind tunnel to see the pressure field on the surface of the Ahmed Body, which is slightly more interesting.)
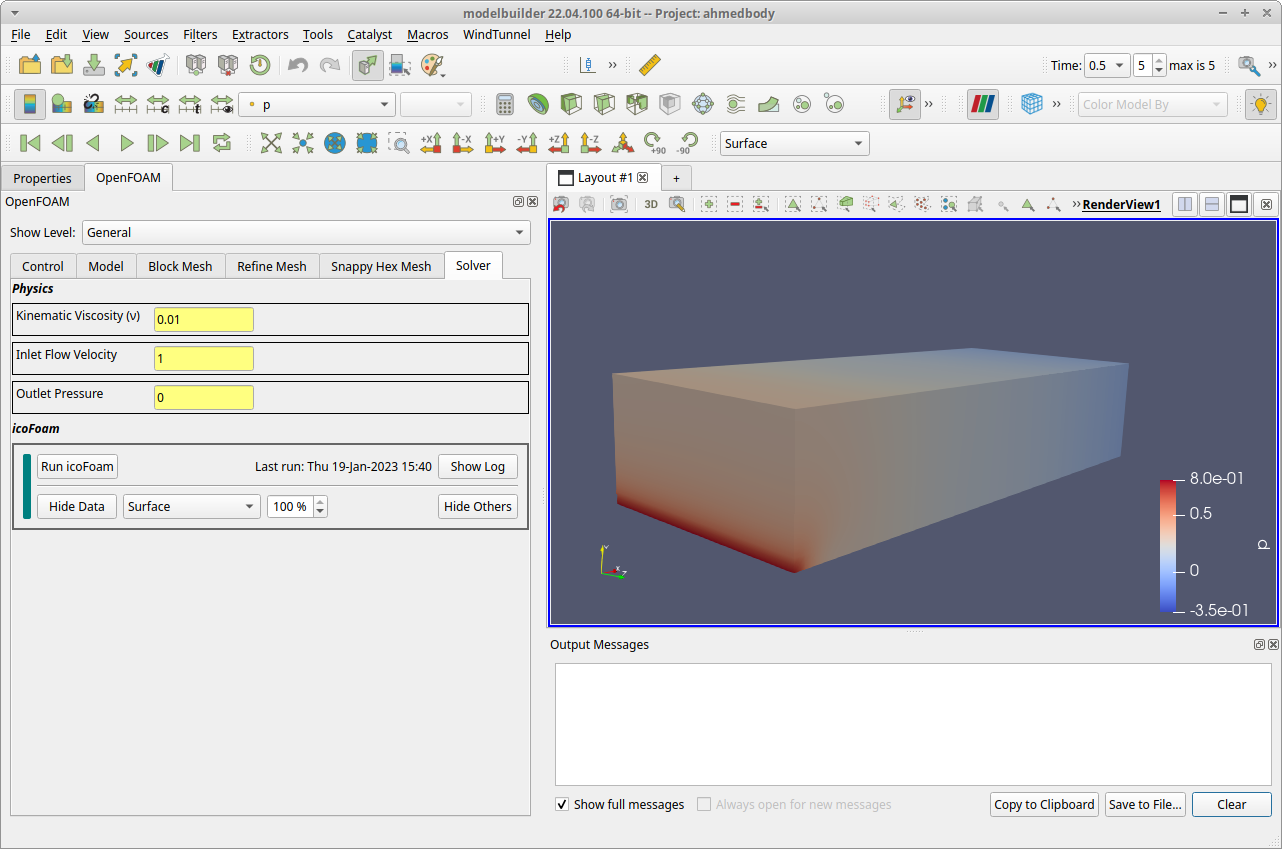
Note
The high pressure (bright red) region at the lower front of the wind tunnel is due to the discontinuity between the inlet velocity (1.0 m/sec) and the stationary floor. In production, we would use a function for the inlet velocity and keep C0 continuity at the floor.
To explore the dataset further, we can take advantage of ParaView`s rich set of visualization features. To demonstrate one of them, we will add a slice plane next.
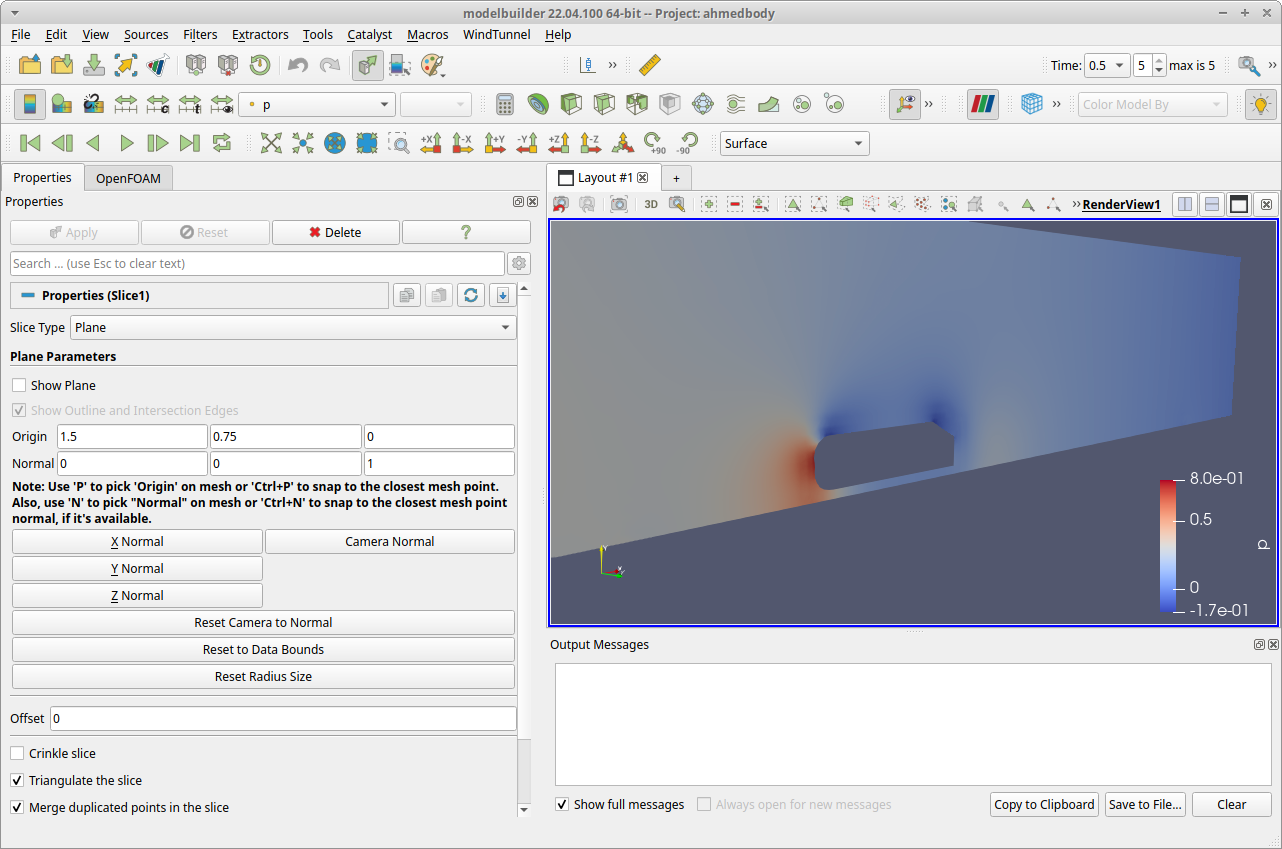
2. Add a Slice Plane
To view the pressure field around the Ahmed Body, add a slice plane to the display by clicking the “Slice” toolbar button (  ). You can also use the menu item.
When the slice plane is displayed, we need to reorient it using the Properties view. If the properties view is not visible, enable it in the menu.
The Properties view has three collapsible sections Properties (Slice1), Display (GeometryRepresentation), View (Render View). Close the second and third sections, and in the Properties (Slice1) section, find the Plane Parameters subsection. There are a number of controls in this section; find and click the Z Normal button to align the slice plane’s normal to be perpendicular to the flow direction. You can grab and drag the red-colored ring to move the plane in the Z direction, and grab the arrow in the center of the widget to adjust the angle. For now, just hide the widget by unchecking the Show Plane box in the properties view. You should be able to see the pressure spike at the front of the body and negative pressure at points on the top surface of the body.