Display the Pressure Field
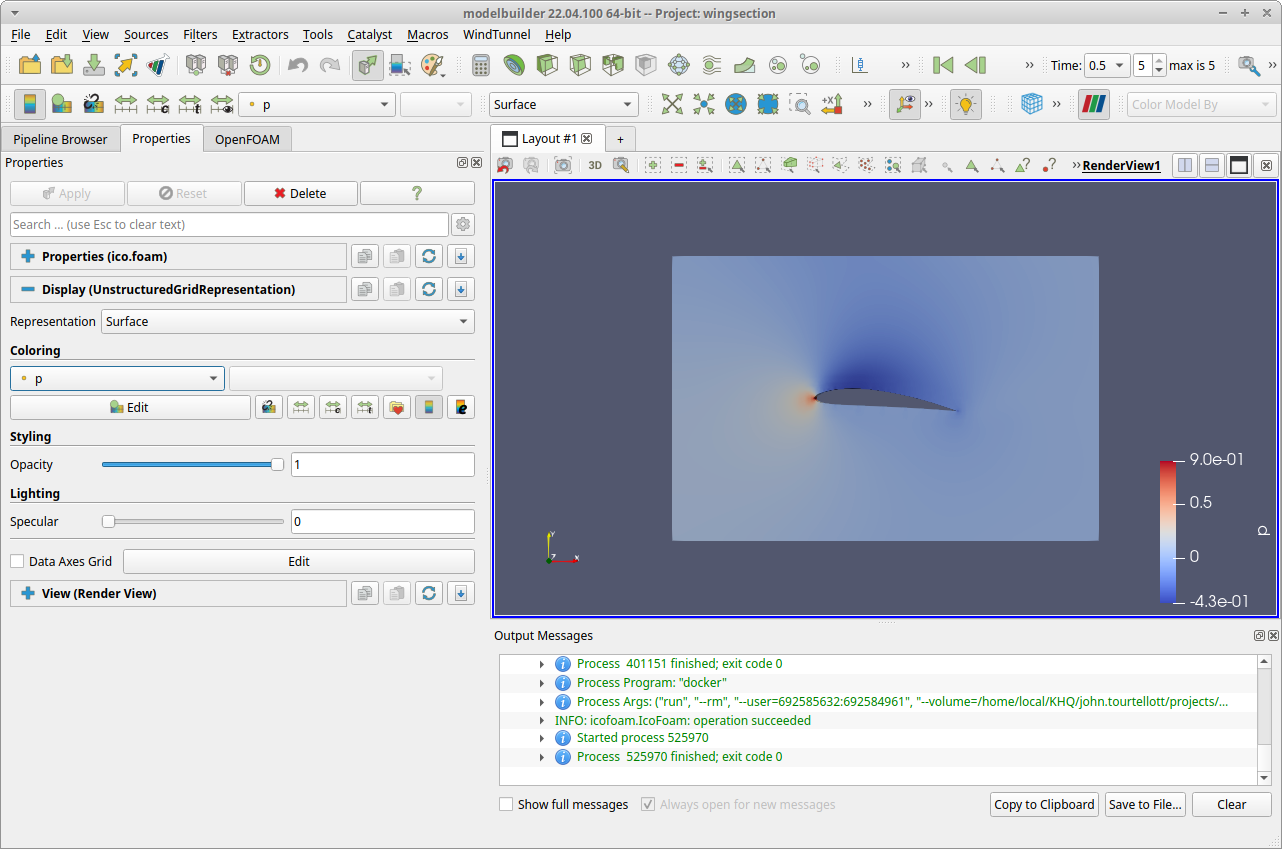
The first results data we will display is the pressure field computed by the icoFoam solver.
1. Load the Data
To see the results, click the Load Data button in the control view, and then click the Hide Others button. This will display the pressure field computed at the initial time step (0.0) as surface data colored by value. In order to see the final pressure field (0.5 sec) computed by icoFoam, we need to first enable the ParaView visualization features.
2. Enable ParaView Features
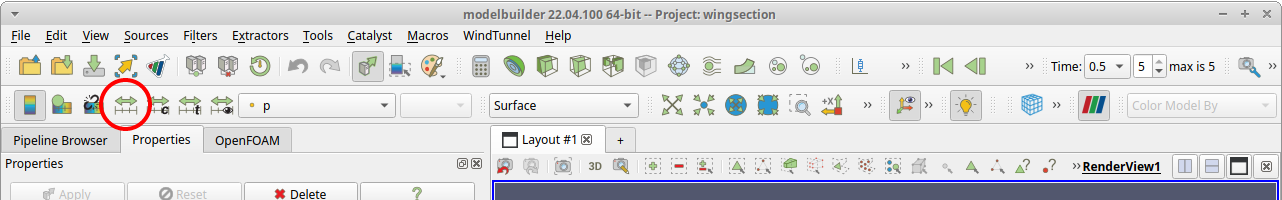
By default, modelbuilder hides the ParaView Pipeline Browser and related toolbars and filters. To make them visible, find and click the “Enable ParaView” toolbar button (  ).
).
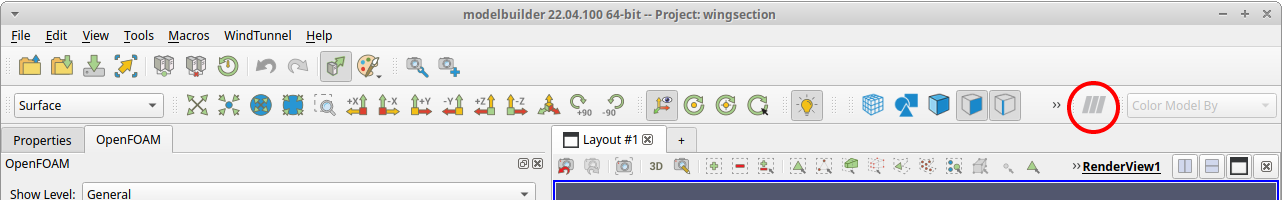
Once clicked, the button will change to the standard ParaView red-green-blue colors, the Pipeline Browser will be displayed in the sidebar, and several additional ParaView toolbars will be displayed. To conserve screen space, close the Pipeline Browser panel (we won’t be using it). Alternatively, you can also undock the Pipeline Browser panel and drag/drop it over the OpenFOAM panel to display it as a tabbed panel.
3. View Final Time step
The pressure field displayed by default is that initial one computed for time 0.0. To see the final time step, find the dropdown box labeled Time in the ParaView toolbars and change it from 0.0 to 0.5.
4. Rescale the Colors
When the data was loaded, the color map in the 3D view was automatically scaled to the range of pressure values in the time 0.0 sec data. To update the color map to the 0.5 sec data, find and click the “Rescale to Data Range” button (  ) in the toolbar area.